library(tidyverse)
internet <- tibble(year = c(2013, 2014, 2015, 2016, 2017, 2018, 2019, 2020),
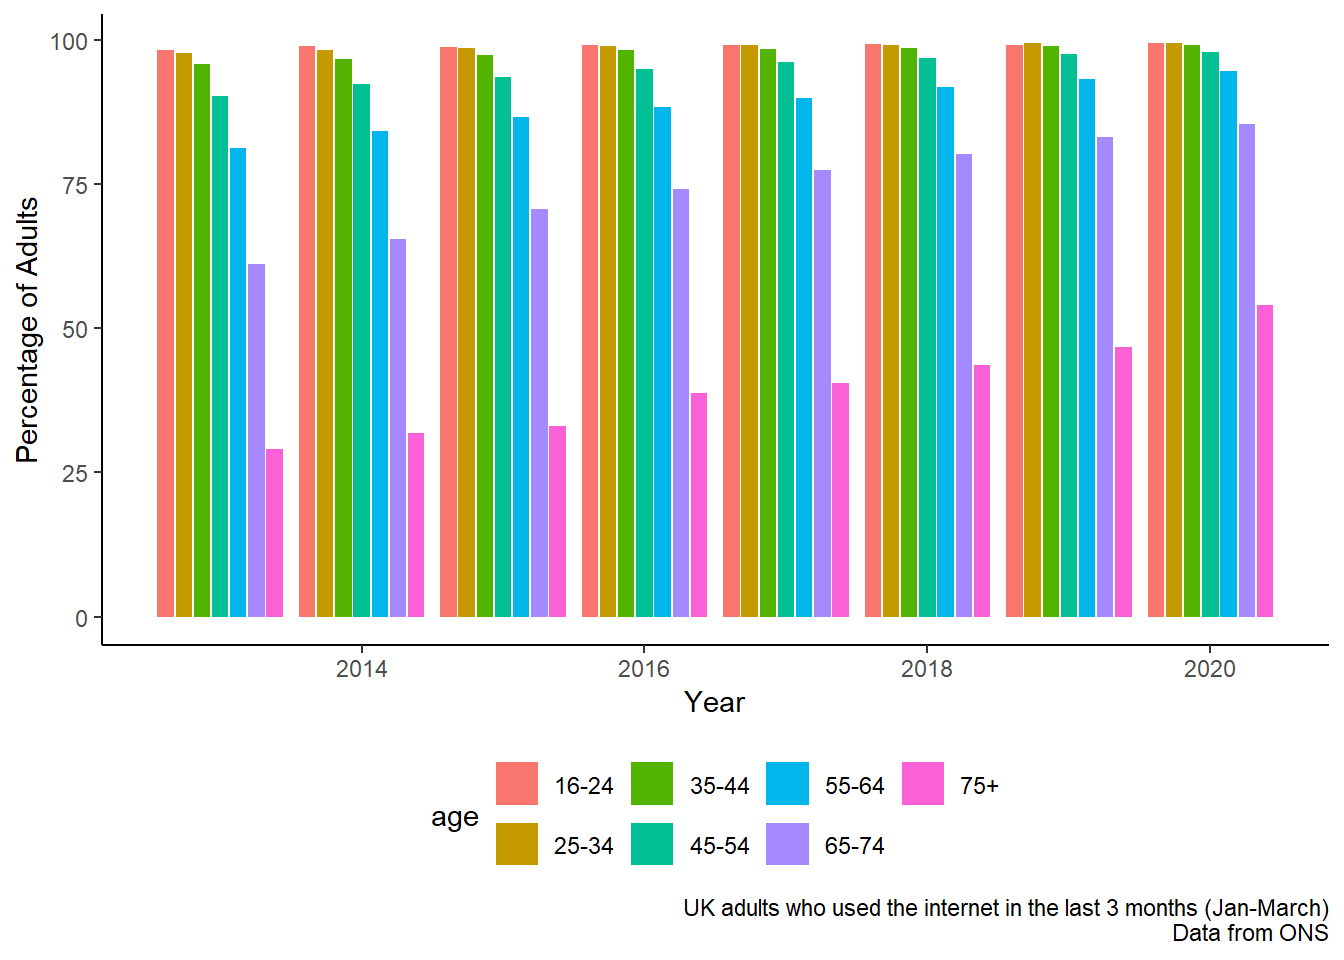
"16-24" = c(98.3, 98.9, 98.8, 99.2, 99.2, 99.3, 99.2, 99.5),
"25-34" = c(97.7, 98.3, 98.6, 98.9, 99.1, 99.2, 99.4, 99.5),
"35-44" = c(95.8, 96.7, 97.3, 98.2, 98.4, 98.6, 98.9, 99.1),
"45-54" = c(90.2, 92.3, 93.6, 94.9, 96.2, 96.8, 97.5, 97.9),
"55-64" = c(81.3, 84.2, 86.7, 88.3, 90.0, 91.8, 93.2, 94.6),
"65-74" = c(61.1, 65.5, 70.6, 74.1, 77.5, 80.2, 83.2, 85.5),
"75+" = c(29.1, 31.9, 33.0, 38.7, 40.5, 43.6, 46.8, 54.0)) |>
pivot_longer(cols = -year,
names_to = "age",
values_to = "perc")
internet |>
ggplot(aes(x = year, y = perc, fill = age)) +
geom_bar(stat = "identity", position = "dodge2") +
theme_classic() +
theme(legend.position = "bottom") +
labs(x = "Year", y = "Percentage of Adults",
caption = "UK adults who used the internet in the last 3 months (Jan-March)\nData from ONS")